BitcoinUses
Bitcoin Blockchain Analysis
Results
- All our results are live on our website
- The following is a stacked column chart made with Excel from the raw data:
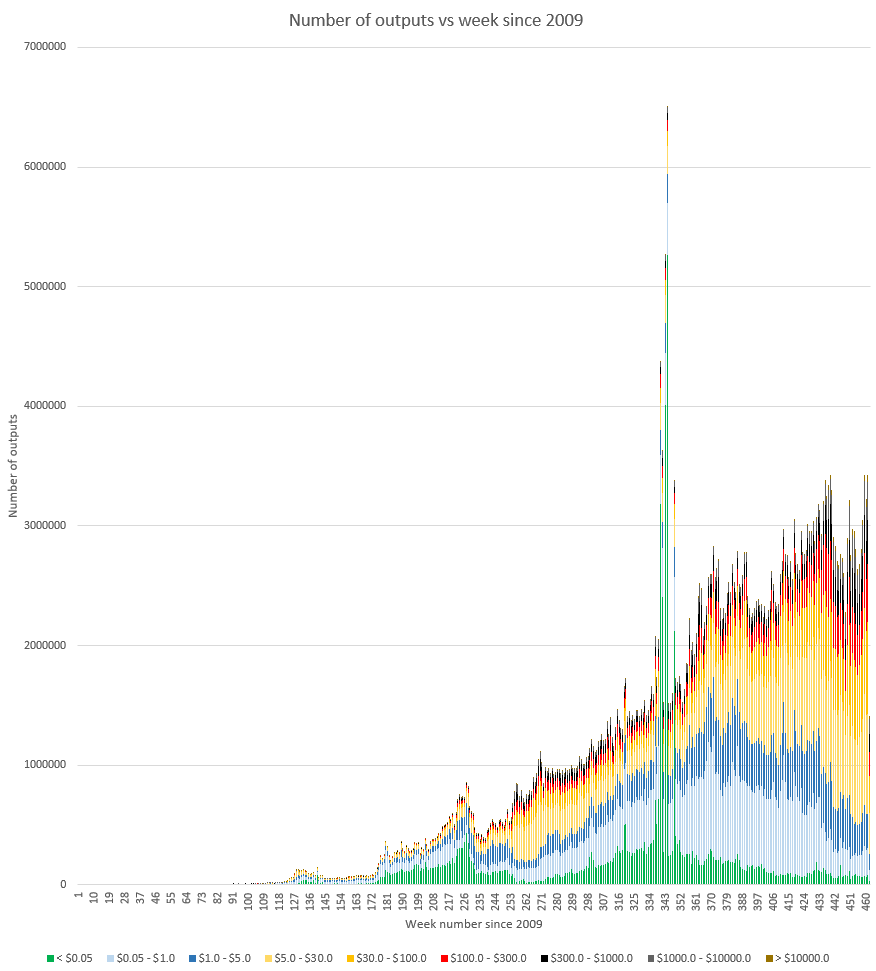
- Raw results are in results.csv
Procedure
- The following diagram illustrates the whole process
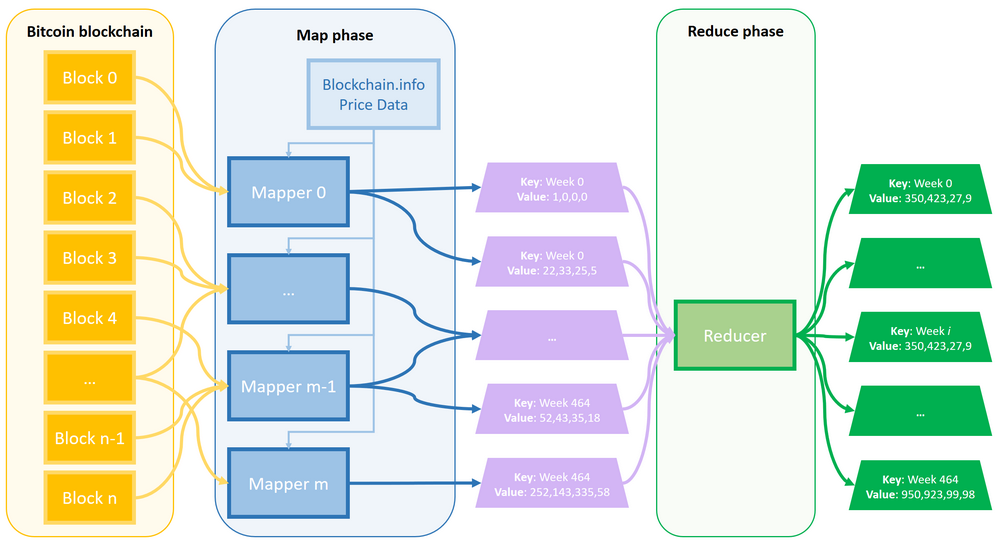
Note that coinbase transactions, change outputs and transaction with a single output are ignored
- Each mapper starts by obtaining historical bitcoin price information
- Information is obtained from blockchain.info
- A weekly average price is computed from the data, since 3 January 2009
- Each bitcoin block is fed to one of the mappers
- The mapper outputs the week number matching the timestamp of the block as the key
- The mapper outputs a map of the counts of outputs for different ranges of money (USD) in the block as the value
- Coinbase transactions are ignored
- Transactions with a single output are ignored
- Change output (largest one in transaction with multiple outputs) is ignored for every transaction
- The key, value pairs from the mappers are fed to the reducer
- The reducer simply sums all the values for each week
- The final output is the key - value pair where
- key: week number since 3 January 2009
- value: counts of outputs per USD value range
Run it
- HDFS setup: Refer to the Data ingestion section
- Program build
- Make sure you have at least Java JDK 1.7 installed; check with:
java -version - Make sure you have Maven installed; check with:
mvn -version - In this directory, enter this command to build the program
mvn clean install
- Make sure you have at least Java JDK 1.7 installed; check with:
- Program run
- In your hadoop environment, enter:
hadoop jar target/blockchain-1.jar /user/cloudera/bitcoin/input /user/cloudera/bitcoin/output - Check the results with:
hdfs dfs -cat /user/cloudera/bitcoin/output/part-r-00000
- In your hadoop environment, enter: